QuantumCat/Features/QuantumPulse
QuantumPulse · 01 of 18
Reading the footprints size leaves behind.
Eight live microstructure trails — options flow, effort vs result, open interest, IV skew, tape anomalies, book persistence, basis, VWAP — fused into one honest read. Plus SwingPulse: trend structure, institutional flow and delivery quality for multi-day holds.
The premise: big orders cannot hide
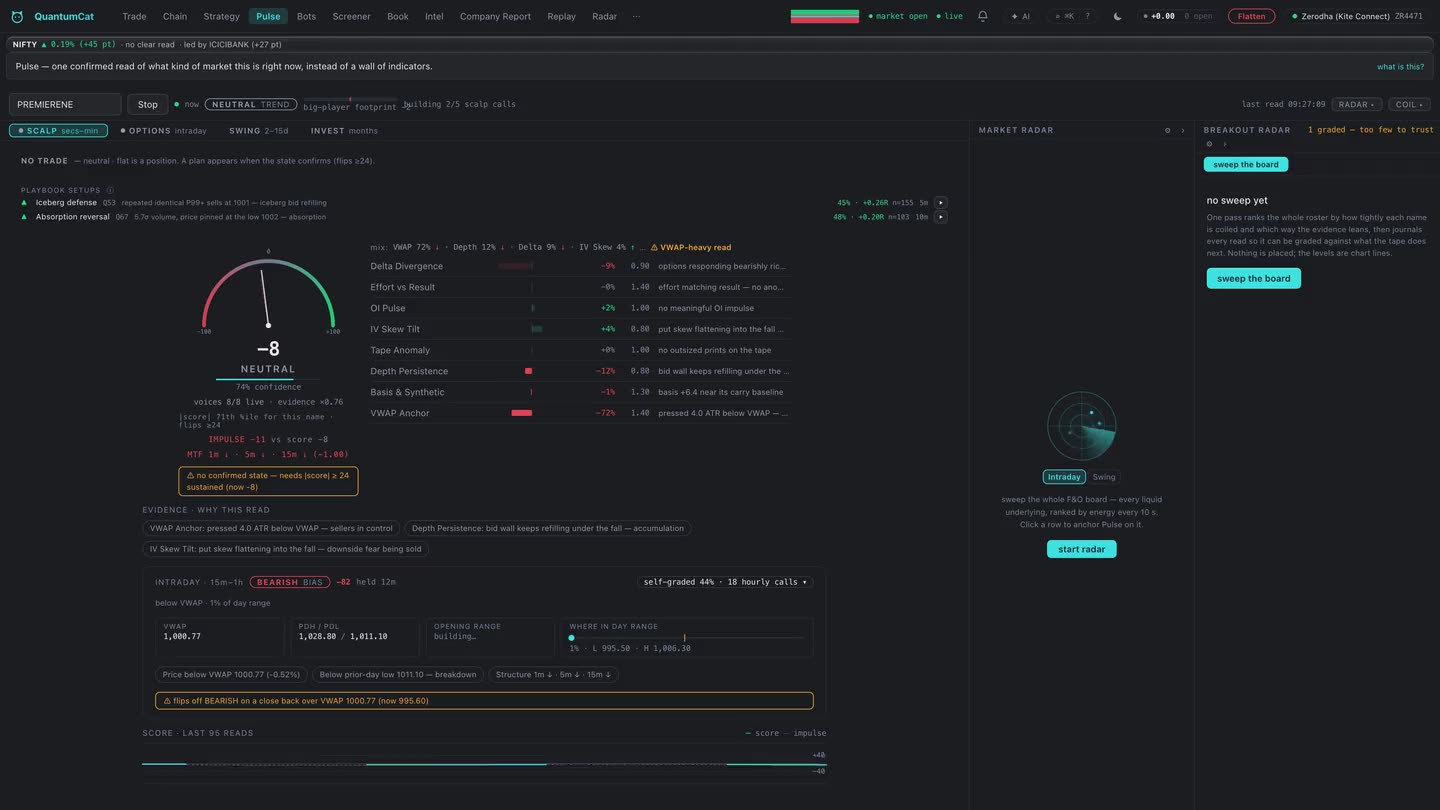
When a large player works a position, they try to hide it — slicing orders, resting icebergs, hedging through options. But working size leaks statistical residue into four places at once: the tape (prints), the order book (depth), the option chain (premiums and open interest) and the futures basis. QuantumPulse watches all four on your own broker feed at one-second resolution, runs eight independent trail detectors — each hunting one residue class — and fuses them into a single −100…+100 score with a confidence band and a per-trail breakdown. You always see why, never just a number.
Pulse is decision support. It measures what is happening in market microstructure; it does not recommend trades, and it can be wrong. That honesty is built in: Pulse grades its own calls against what the market did next and shows you its live hit-rate.
The 8 intraday trails
T1 Delta Divergence — options vs cash
For strikes around ATM (both calls and puts), T1 regresses each option’s actual price response against the spot move over a rolling window: the realized delta. It compares that against the theoretical delta from Black-76 using live implied volatility inverted from the quotes each second.
Why this matters: if the index drops 100 points but puts gain less than their delta implies while calls lose less than theirs, someone with size is writing puts into the fall and call holders aren’t selling — the options market is absorbing the move. That’s institutional positioning you cannot see on a price chart. The signal is amplified when the move happens on fading volume (a fall nobody is paying for).
Each leg pairs its own inter-tick move with the spot move over the same interval — never a stale quote against a fresh spot print — and the divergence is z-scored against its own trailing distribution, so “unusual” always means unusual for this instrument today.
T2 Effort vs Result + CVD divergence
Every second: effort = traded volume as a z-score against the session’s own distribution; result = how far price actually moved in ticks. Tick-rule signed volume accumulates into CVD (cumulative volume delta — an estimate of net aggressive buying vs selling).
Why this matters: huge effort with no result at the session low is absorption — someone is buying everything thrown at them (bullish). Price making a lower low while CVD makes a higher low means the second push down had less real selling behind it — the classic accumulation divergence. Both are order-flow facts, not chart patterns.
All of T2's state — CVD, rolling windows, the volume distribution — resets at the session boundary, so a gap open is never misread as a divergence against yesterday’s tape.
T3 OI Pulse — who is writing
Per-strike open-interest change around ATM, cross-classified with the option’s price response per unit of spot move: put OI rising while puts bleed per-move means puts are being written into the decline (a bullish commitment — writers are betting the fall won’t hold). Futures OI is classified the same way: OI building on an up-move = fresh longs; OI dropping on an up-move = short covering (weaker).
Why this matters: open interest is the one number that distinguishes new commitment from position exit. Price up + OI up is a very different market from price up + OI down, and options writing intensity tells you where professionals are selling insurance.
T4 IV Skew Tilt — the fear gauge’s first derivative
Skew = mean implied volatility of out-of-the-money puts minus OTM calls, tracked as a rate of change around a sticky ATM reference (so a 1-point spot wiggle across a strike can’t fabricate a step).
Why this matters: when spot is falling but put skew is flattening, downside insurance is being sold, not bought — the people who price risk for a living are fading the fall (bullish). When spot rallies but the call IV bid dries up, nobody is paying up for more upside — a distribution warning.
T5 Tape Anomaly — iceberg residue
T5 keeps the session’s own P99 of per-print traded quantity and looks for clusters of oversized prints at one level that repeatedly fail to move price — the signature of an iceberg refilling — plus repeated identical-size prints (algorithmic slicing). Side is inferred from where the trade printed against the prevailing bid/ask.
Why this matters: an iceberg is invisible in the order book by design. The only place it shows is the tape — a level that keeps absorbing P99-sized aggression without breaking is a level someone large is defending.
T6 Depth Imbalance Persistence — spoof-filtered
A distance-weighted imbalance across five book levels, smoothed over time — but each level is discounted against its own persistence baseline: size that flashes and vanishes when price approaches (spoofing) is ignored; only liquidity that stays and refills counts.
Why this matters: raw book imbalance is the most gamed number in markets — spoofers paint it all day. Persistence is what they can’t fake cheaply: a bid wall that keeps refilling under a falling price is real accumulation, and that’s the only kind of wall T6 scores.
T7 Basis & Synthetic Premium — what size pays for
The futures basis (future − spot) z-scored against its own carry-adjusted baseline, plus the synthetic future built from the option chain (call − put + strike) compared to the real future. The mid-derived synthetic leg is damped by chain tightness, so wide illiquid quotes can’t fake a signal.
Why this matters: when spot drops but the basis expands or the synthetic trades rich, leveraged money is paying a premium for upside exposure while price falls — they’re positioning against the move. Basis is where index-scale money is most visible.
T8 VWAP Institutional Anchor
Distance from session VWAP in ATR units, plus the classic institutional re-anchor: a sweep of a prior 1-minute low followed by a high-volume VWAP reclaim. Includes an anchored VWAP from the session’s highest-volume bar.
Why this matters: VWAP is the benchmark institutional execution desks are graded against, which makes it a real battle line, not a mystical level. A stop-sweep under a prior low that immediately reclaims VWAP on volume is the footprint of a desk clearing the book before taking price higher.
Fusion: eight opinions, one honest read
Each trail outputs a signal in [−1, +1] and a confidence in [0, 1] (data sufficiency, feed freshness, sample count). Fusion is a confidence-weighted blend, re-weighted by a regime detector (Kaufman efficiency ratio + realized-volatility percentile): trend regimes boost the trend-following trails (T2/T7/T8), compression regimes boost the positioning trails (T1/T3/T4), event spikes boost the tape/book trails (T5/T6).
- Hysteresis, not flicker: NEUTRAL flips to BULLISH only when the score holds ≥ +35 for a sustained window, and exits at +15 (mirrored for bearish). A one-second spike can never flip the state.
- Disagreement is shown, not hidden: the confidence band is trail agreement — when trails disagree, Pulse says “mixed” even if the raw score is large.
- Three horizons: a ~4-second impulse (where evidence points right now), the 20–40s score (what the state machine confirms), and a ~4-minute bias (the intraday campaign read). An early build cue fires when impulse and thrust align before the confirmed flip — labeled early/unconfirmed, deliberately.
- Session-boundary hygiene: every session-scoped accumulator (VWAP, extremes, CVD, per-trail windows) resets at the IST day boundary and after any long feed gap, so a warm engine never carries yesterday’s tape into today’s open.
- Cash-only instruments run T2/T5/T6/T8 (plus T7 when futures exist); anything with an option chain runs all eight.
Pulse 2.0: from a read to a plan you can check
A score tells you what the market is doing. Pulse 2.0 closes the rest of the distance to an actual decision — while keeping every call checkable and the final choice yours.
- Calibrated to each name, not to NIFTY. A quiet stock’s evidence is measured against its own rhythm (event-time statistics for sparse tapes) and its own score distribution — the gauge shows the score’s percentile for this name and the flip band adapts (loosen-only, floored). A +14 that’s a 94th-percentile reading finally says so.
- The plan, in prices. Every confirmed flip is delivered as a frozen plan: entry reference, an invalidation price and an objective price — each named for the structure it sits on (VWAP, opening range, prior day, OI walls; ATR fallback labeled honestly) — with the risk:reward they imply. Levels freeze at the flip and draw on the chart; one click stages the trade (risk-sized from your ₹-per-trade setting, protective SL/target riding into the ticket) and arms a one-shot alert at the invalidation. Nothing ever auto-submits.
- A playbook, not a needle. Six named, once-per-occurrence setups — VWAP sweep-reclaim, absorption reversal, iceberg defense, wall defense, ORB failure trap, basis-rich thrust — each graded for regime fit and structure alignment.
- The proof engine. Every setup instance is shadow-graded against its own plan levels (first-touch, conservative tie-breaks), accumulating a live per-name record — win rate and average R — shown before the trade. Structural setups are also mined from the name’s own 1-minute history with a chronological train/test split; the out-of-sample number is the one displayed. A setup whose live record goes negative over a real sample demotes itself and stops paging.
- A calibrated probability, not a vibe. Each anchor trains its own small model on those shadow outcomes; once enough are graded, the plan shows P(objective before invalidation) — sample-shrunk toward 50% while thin, with reliability bins kept so the claim is auditable against what actually happened.
- Stand-down. Your own realized P&L is attributed to the regime and session phase it was booked in. When your record says you lose in the current context, Pulse says so, plainly. Advisory only — it informs; your risk caps gate.
- Hunter + drills. The whole-market radar flags setup precursors ("at VWAP with fuel") across the F&O board — click to anchor for confirmation — and any setup can be replayed at its exact moment against the recorded tape for practice.
SwingPulse: the same discipline on daily evidence
Scalps live in microstructure; multi-day holds live in a different information regime. SwingPulse reads daily-resolution evidence for 2–15 session holds, fused with the same confidence-weighted, disagreement-honest machinery, and stamped “as of the last completed session” — it never blends today’s half-formed candle into the read.
| Trail | What it measures | Why it’s in the model |
|---|---|---|
| S1 · Trend structure | Daily EMA20/50 posture, where price sits relative to both, and the Kaufman efficiency ratio (how directly price got there). | Trend is the base rate. A clean EMA stack with high efficiency means moves have follow-through; a tangled one means mean-reversion odds. Everything else is read against this backdrop. |
| S2 · Institutional flow | FII/DII cash-market buying/selling streaks (self-accumulated day by day from NSE data) plus the drift in FII index-futures net positioning. | Foreign and domestic institutions move size that takes days to weeks to deploy. Persistent one-sided flow is the tide a swing trade swims in — fighting it lowers the odds. |
| S3 · Accumulation / delivery quality | For stocks: delivery percentage on up-days vs down-days (from NSE delivery archives). For indices: classification of futures OI builds. | Delivery is the cash-settled truth serum: a rally on high delivery-% is being taken home (conviction); a rally on low delivery is intraday churn. Up-days carrying better delivery than down-days is the signature of quiet accumulation. |
| S4 · Vol regime | India VIX percentile and its 5-session slope, plus an ATR squeeze note. | The same setup behaves differently at VIX P20 vs P90. Low-and-falling vol favours continuation; spiking vol widens stops and flips base rates — position sizing needs to know. |
| S5 · Relative strength | For stocks: 20-day return vs NIFTY. For indices: 12-day momentum z-score. | Money rotates; it doesn’t evaporate. A stock beating its index while the tape chops is where institutional demand is concentrating — strength begets strength on swing horizons. |
| S6 · Event gate | Scheduled results/events inside the hold horizon. | An earnings date inside your horizon is coin-flip risk no chart can price. The gate damps confidence, never fabricates direction. |
SwingPulse also self-grades: each directional call is raced against an ATR-scaled hurdle over the following sessions, and the honesty badge shows hits, misses and pending — so you know how the model has actually been doing on this instrument, not how it feels.
What Pulse is not
Not investment advice, not a tip stream, not a black box. Every read shows its trails; every trail can be wrong; illiquid chains, feed gaps and news shocks all degrade it — and the confidence band says so when they do. Pulse tells you what the market’s plumbing is doing. The trade, and the risk, are yours.