QuantumCat/Features/Company Report
Company Report · 07 of 18
Take apart any listed company.
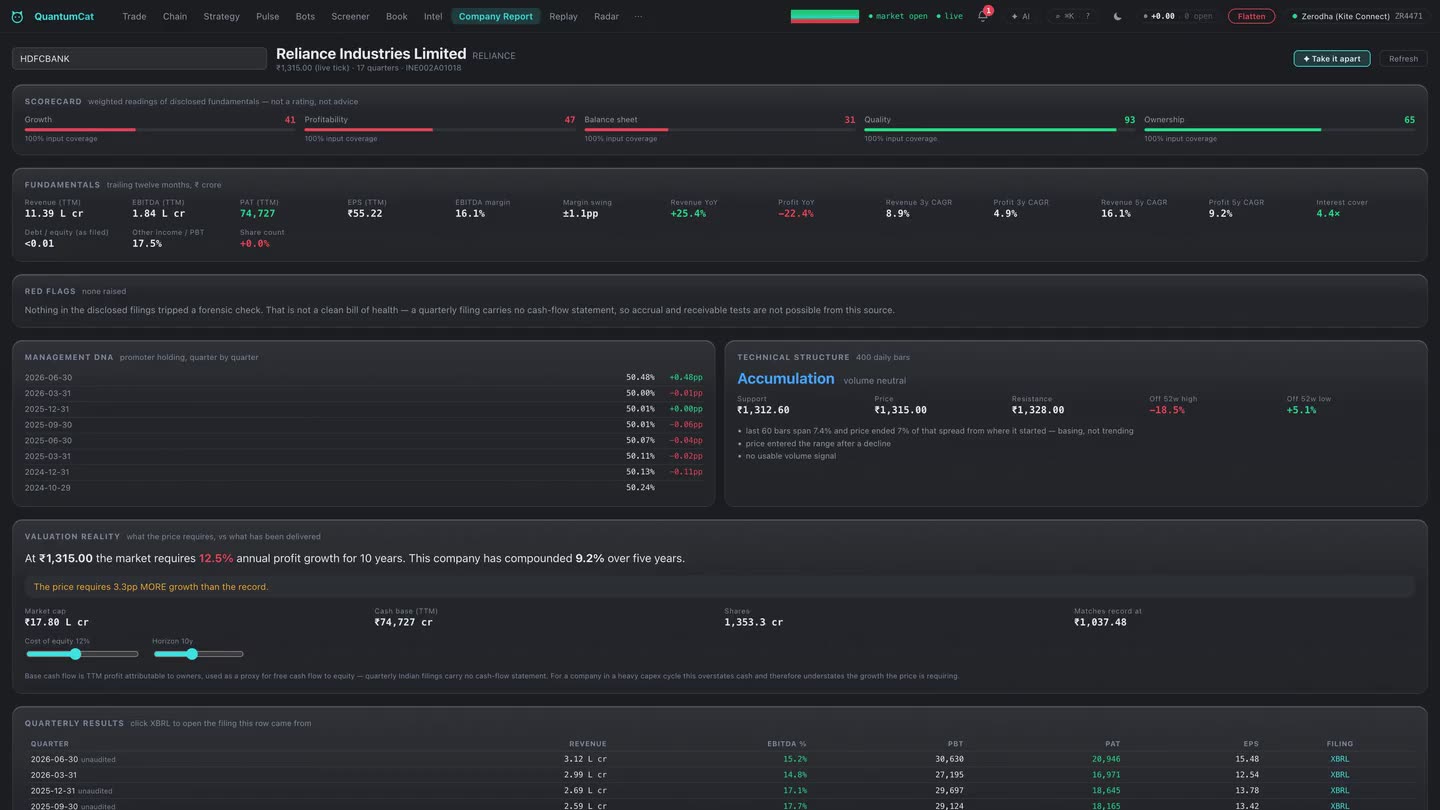
A six-dimension teardown built from the exchange’s own filings — five scored pillars that show how much was actually disclosed, forensic flags with their evidence attached, and a reverse DCF that tells you what growth the price is already assuming.
Company Report: filings, red flags, reverse DCF0:46 · narrated · real build
A teardown, not a statement browser
A trading terminal’s user is deciding whether to take a position, not preparing an annual-report summary. So the Company Report opens as a six-dimension teardown of any listed Indian company — fundamentals, management, valuation, technical structure, risk, and the read that falls out of them — built from the exchange’s own filings rather than from a data vendor’s cleaned-up copy.
It works on every broker, and with none signed in: the filings come from NSE. Price, the reverse DCF and the technical read need a session for a quote, and they say so in their own words rather than showing an error — then fill themselves in the moment a broker signs in. Open a future or an option and it resolves to the issuer behind it.
Two rules the whole panel is built on
- Absent is never zero. Every monetary field arrives as a number or as nothing, and nothing means the filer did not disclose it. An em-dash is printed for absent, never ₹0 — because ₹0 reads as a fact about the company, and it isn’t one.
- Every number is one click from its filing. Each quarter carries the XBRL URL it was parsed from, and every forensic flag carries its evidence inline. A claim you cannot check is a rumour, and this panel does not print rumours.
The scorecard: five pillars, each with its coverage
Growth, Profitability, Balance sheet, Quality and Ownership are scored from the disclosed inputs — and each bar carries the percentage of its own inputs that were actually disclosed, plus the drivers behind the reading. A pillar with nothing disclosed shows no bar at all rather than a confident-looking zero.
Why it matters: a “score” built from 30% of its inputs and one built from 100% look identical in every other tool. Here they never do. It is a weighted reading of what was filed, not a rating and not advice.
Red flags, with the evidence attached
The forensic pass looks for the things that are visible in filings and easy to miss when you are reading quickly:
- Recurring exceptional items — operating costs reported below the line, quarter after quarter.
- A modified auditor opinion, where any filing in the disclosed history declares one.
- Promoter holding falling — both the last quarter’s step and the drift across the whole disclosed history.
- Thin interest cover — how many times operating profit covers the interest bill.
- Profit outrunning revenue — a profit line growing far faster than sales, which has to be coming from somewhere.
- An effective tax rate away from statutory, stated against the statutory rate rather than left for you to remember.
- Share-count dilution, separated into the step that brought earnings with it and the drift that did not.
- Margin volatility — the swing around the average, because an average margin hides a range you have to size against.
When nothing trips, it does not congratulate the company. “None raised” is printed beside the reason it is not a clean bill of health — a quarterly filing carries no cash-flow statement, so accrual and receivable tests are not possible from this source.
And the part most tools leave out: what could not be checked, and why. “Fewer than two quarters of promoter holding are disclosed, so a change cannot be measured.” “Finance costs and/or depreciation are not tagged in these filings.” A check that did not run is reported as a check that did not run — never as a clean bill of health.
Valuation reality: the reverse DCF
Instead of producing a target price, the panel runs the discounted cash flow backwards: given today’s market capitalisation and the cost of equity and horizon you set, what growth rate would the company have to deliver to justify this price? It reads as one sentence — at ₹1,315 the market requires 12.5% annual profit growth for ten years; this company has compounded 9.2% over five — and then states the gap in percentage points, and the price at which the requirement would match the record.
It also tells you what its own base number is and where that number is weak: quarterly Indian filings carry no cash-flow statement, so trailing profit attributable to owners stands in for free cash flow — which overstates cash for a company in a heavy capex cycle, and therefore understates the growth the price is requiring. That sentence is on the panel, not in a footnote.
Why this way round: a forward DCF is a machine for producing whatever number you already wanted; you pick the growth, and the target obeys. A reverse DCF hands you one number you cannot flatter — the expectation baked into the price — and leaves the judgement where it belongs.
You can also compare hypothetical prices as named cases against the report’s own reference price — with the discount rate, horizon and terminal growth all yours to set — and pin reports side by side when you are choosing between two companies rather than judging one.
The rest of the teardown
- Fundamentals — trailing twelve months in ₹ crore, with the quarterly series behind it and a link to every filing.
- Management DNA — promoter holding, quarter by quarter, so a pattern is visible rather than a single latest figure.
- Banking mode — a lender’s own P&L shape when the filer is a bank, instead of a manufacturer’s template forced onto it.
- Segments, as filed, for the latest period that discloses them.
- Dividend record — what was actually paid, and the trailing cash yield that follows from it.
- Events — ex-dates, board meetings and announcements.
- Technical structure — the phase read, stated with the number of daily bars it was built from.
- What is missing, and why — its own card, at the bottom, every time.
Four research workspaces on top of the report
The teardown is what the exchange filed. These four are what you build on top of it — retained privately on your own machine, each keeping the filing’s reported facts, the parser’s extracted values and your own notes strictly separate, so nothing you write can quietly become something the company said.
- Financial statements. Retained filings with cash flow, financial position and returns worked out from them, plus evidence checks that show their own workings.
- Valuation & peers. Retained valuation captures kept as history rather than overwritten, against versioned peer groups — so a comparison made three months ago still says which peers it was made against.
- Earnings. Claims bound to their sources, with revisions: revise, withdraw or restore, each requiring a new source, with the full revision history readable and any historical revision usable in a comparison without replacing the current one.
- Ownership. Private ownership filings, parsed and analysed, with the comparisons scoped to what was actually filed.
The collector
Filings for the companies you hold, watch or ask about are acquired automatically — bounded scheduling through the same exchange client the app already paces, cached, deduplicated and versioned in a private ledger, retried with backoff, with its status visible rather than silent. Every acquired document shows which filing it is, when the exchange published it, what was extracted from it and where the original lives. Manual import stays the fallback everywhere, and the collector’s switch, targets and manual passes live in Settings.
What the Company Report is not
It is not a recommendation, a rating or a target price, and it does not tell you to buy or sell anything. It reads what companies filed and shows you the arithmetic — including the arithmetic it could not do. Filings can be late, wrong or restated; XBRL tagging is uneven across filers, which is exactly why the coverage percentages and the “not checked” lines are on screen. Do your own work; the position, and the risk, are yours.